Role & Responsibilities
- → Led end-to-end design
- → Cross-functional project management
- → Strategic workshop facilitation
- → Design mentorship
Team
- → Analytics & Finacial PMs (+2)
- → Design Architect
- → Technical Writer
- → Engineers
The challenge
Business Views was born from two key problems: Obscure data model and disconnected data.
Obscure Data Model: Workday’s data model is vast, with over 1000 distinct business objects* and fields*— this made it overwhelming for financial users, especially those unfamiliar with the Workday data model, to find the right data for reporting.
Disconnected Data: Workday's data is not well-connected and users couldn’t easily view data from multiple sources in one table, so they had to manually join data while building reports—a process that was both complicated and time-consuming.
*Think of the data model as a map connecting books and pages—where each Business Object is a book, and its fields are the pages inside.
→ How might we make data more easily discoverable & understandable?
The Impact
Secured early adoption from 50+ financial customers through the EA program, signaling strong solution demand and validation ahead of launch.The Solution
Business Views enables users to blend and curate multiple business objects to create a single data source that better meets their needs within in the existing data modeling layer so that can be directly used across reportings.

The Process
Define UX roadmap: To kick off the initiative, I stepped back to look at the bigger picture and mapped out a UX roadmap centered on two key questions: How will users manage Business View data differently, and how will this impact analysis and reporting?
Facilitate design thinking workshop: To dig deeper, I co-led a 2-day design thinking workshop with the Business View and Discovery Boards (one of workday reporting tools) teams . This helped us align on user needs, validate assumptions, and surface new opportunities.
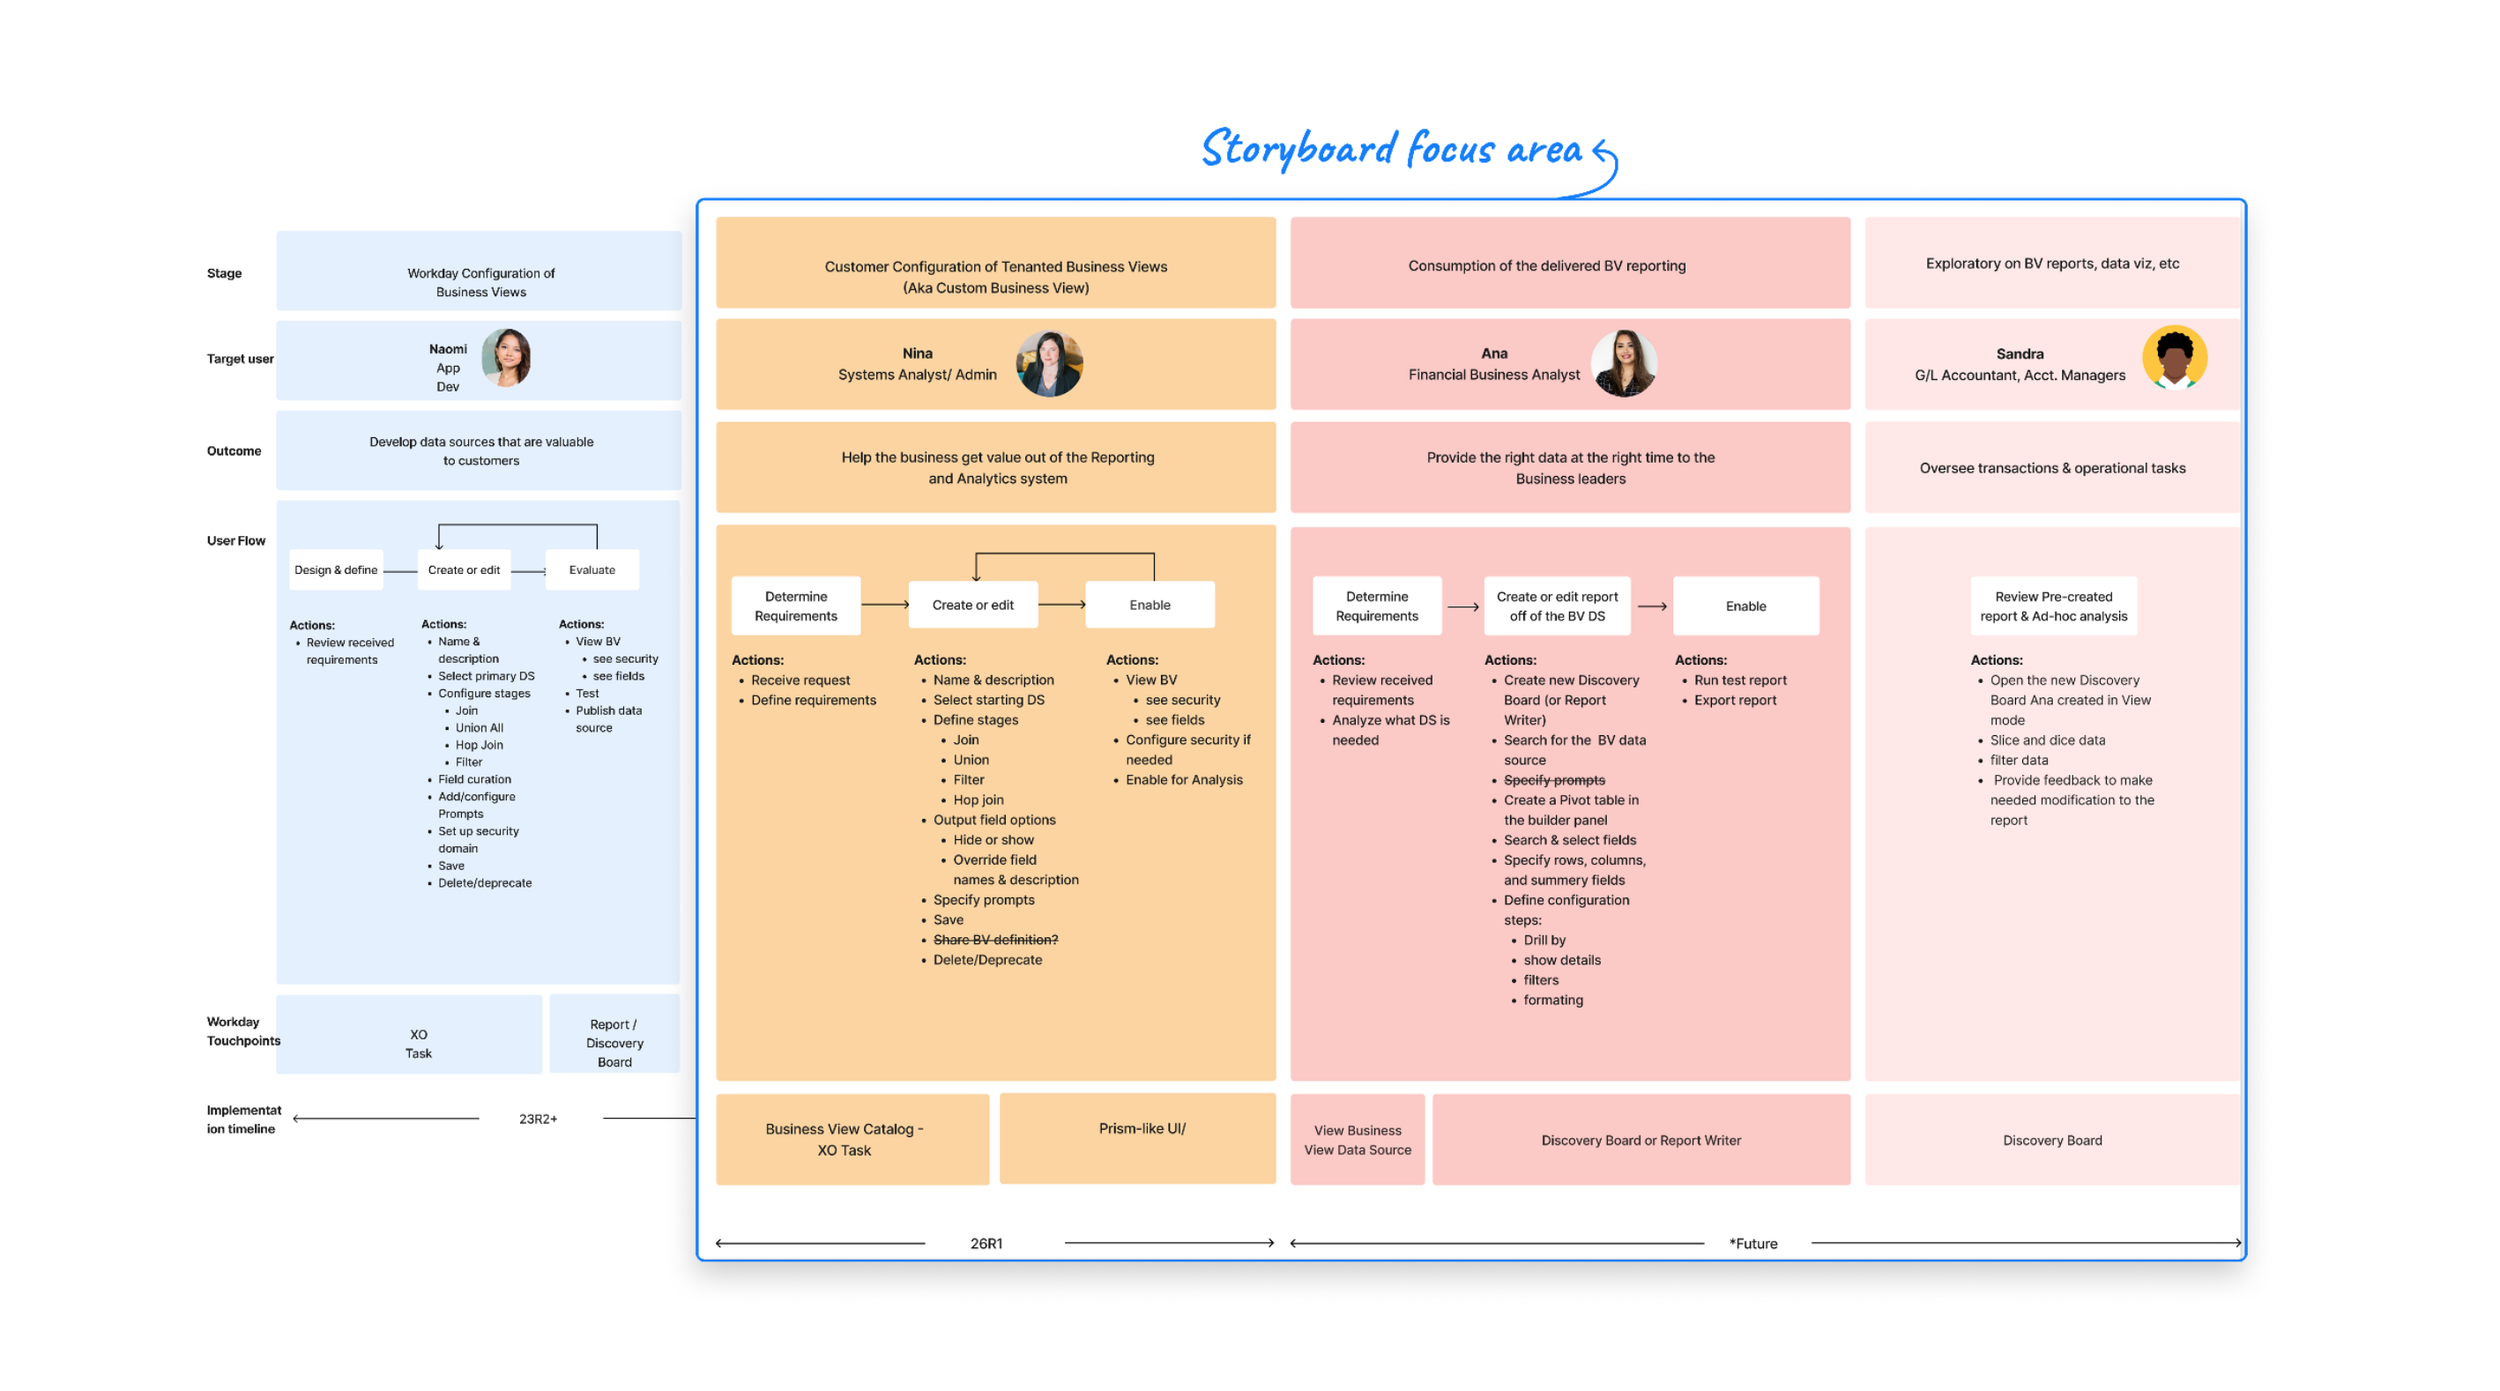
Craft a high-level user flow & visionary storyboard: Coming out of the workshop, I mapped ahigh level user flow and collaborated with both Business view and Discovery Boards team to craft a visionary storyboard to communicate a future experience that connected Business Views configuration, data management, and analysis.
Run impact/effort analysis exercise: Finally, I worked with PM and devs to run an impact/effort analysis to prioritize features, identify quick wins, and shape the MVP scope for the design.
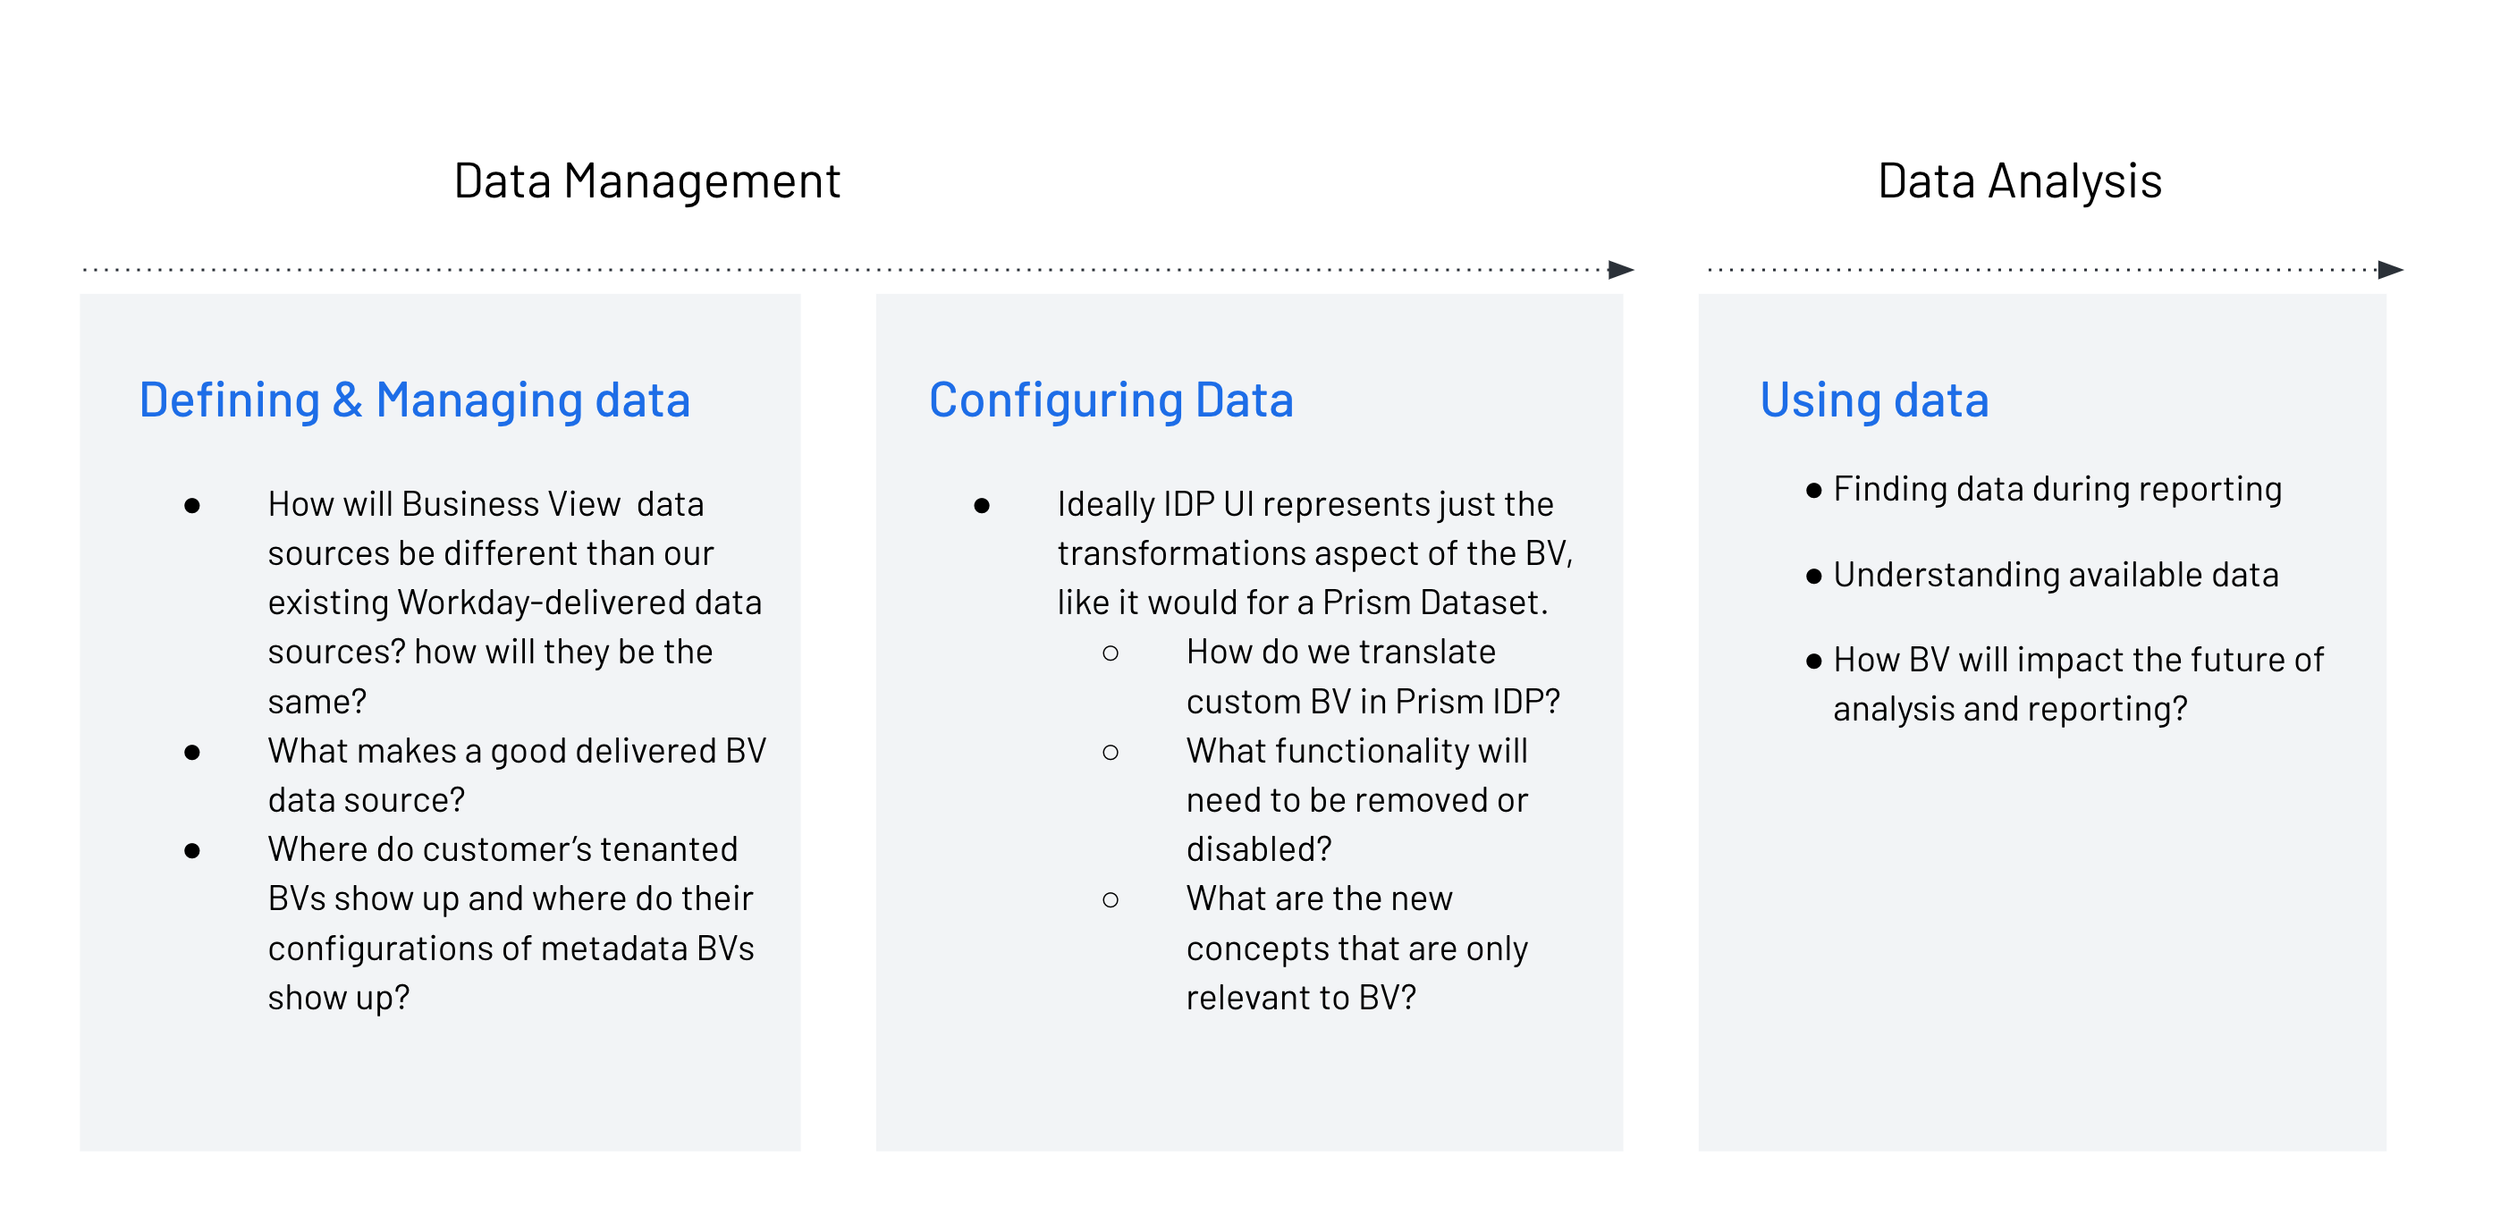
UX Roadmap
The Bucket of UX Work to Address

Design Thinking Workshop
Problem & Opportunities Alignment
high-level User Flow

Storyboard
High-level Design Direction

Impact/Effort Analysis
Where to Focus to Get the Most Value?
Design Sneak Peek
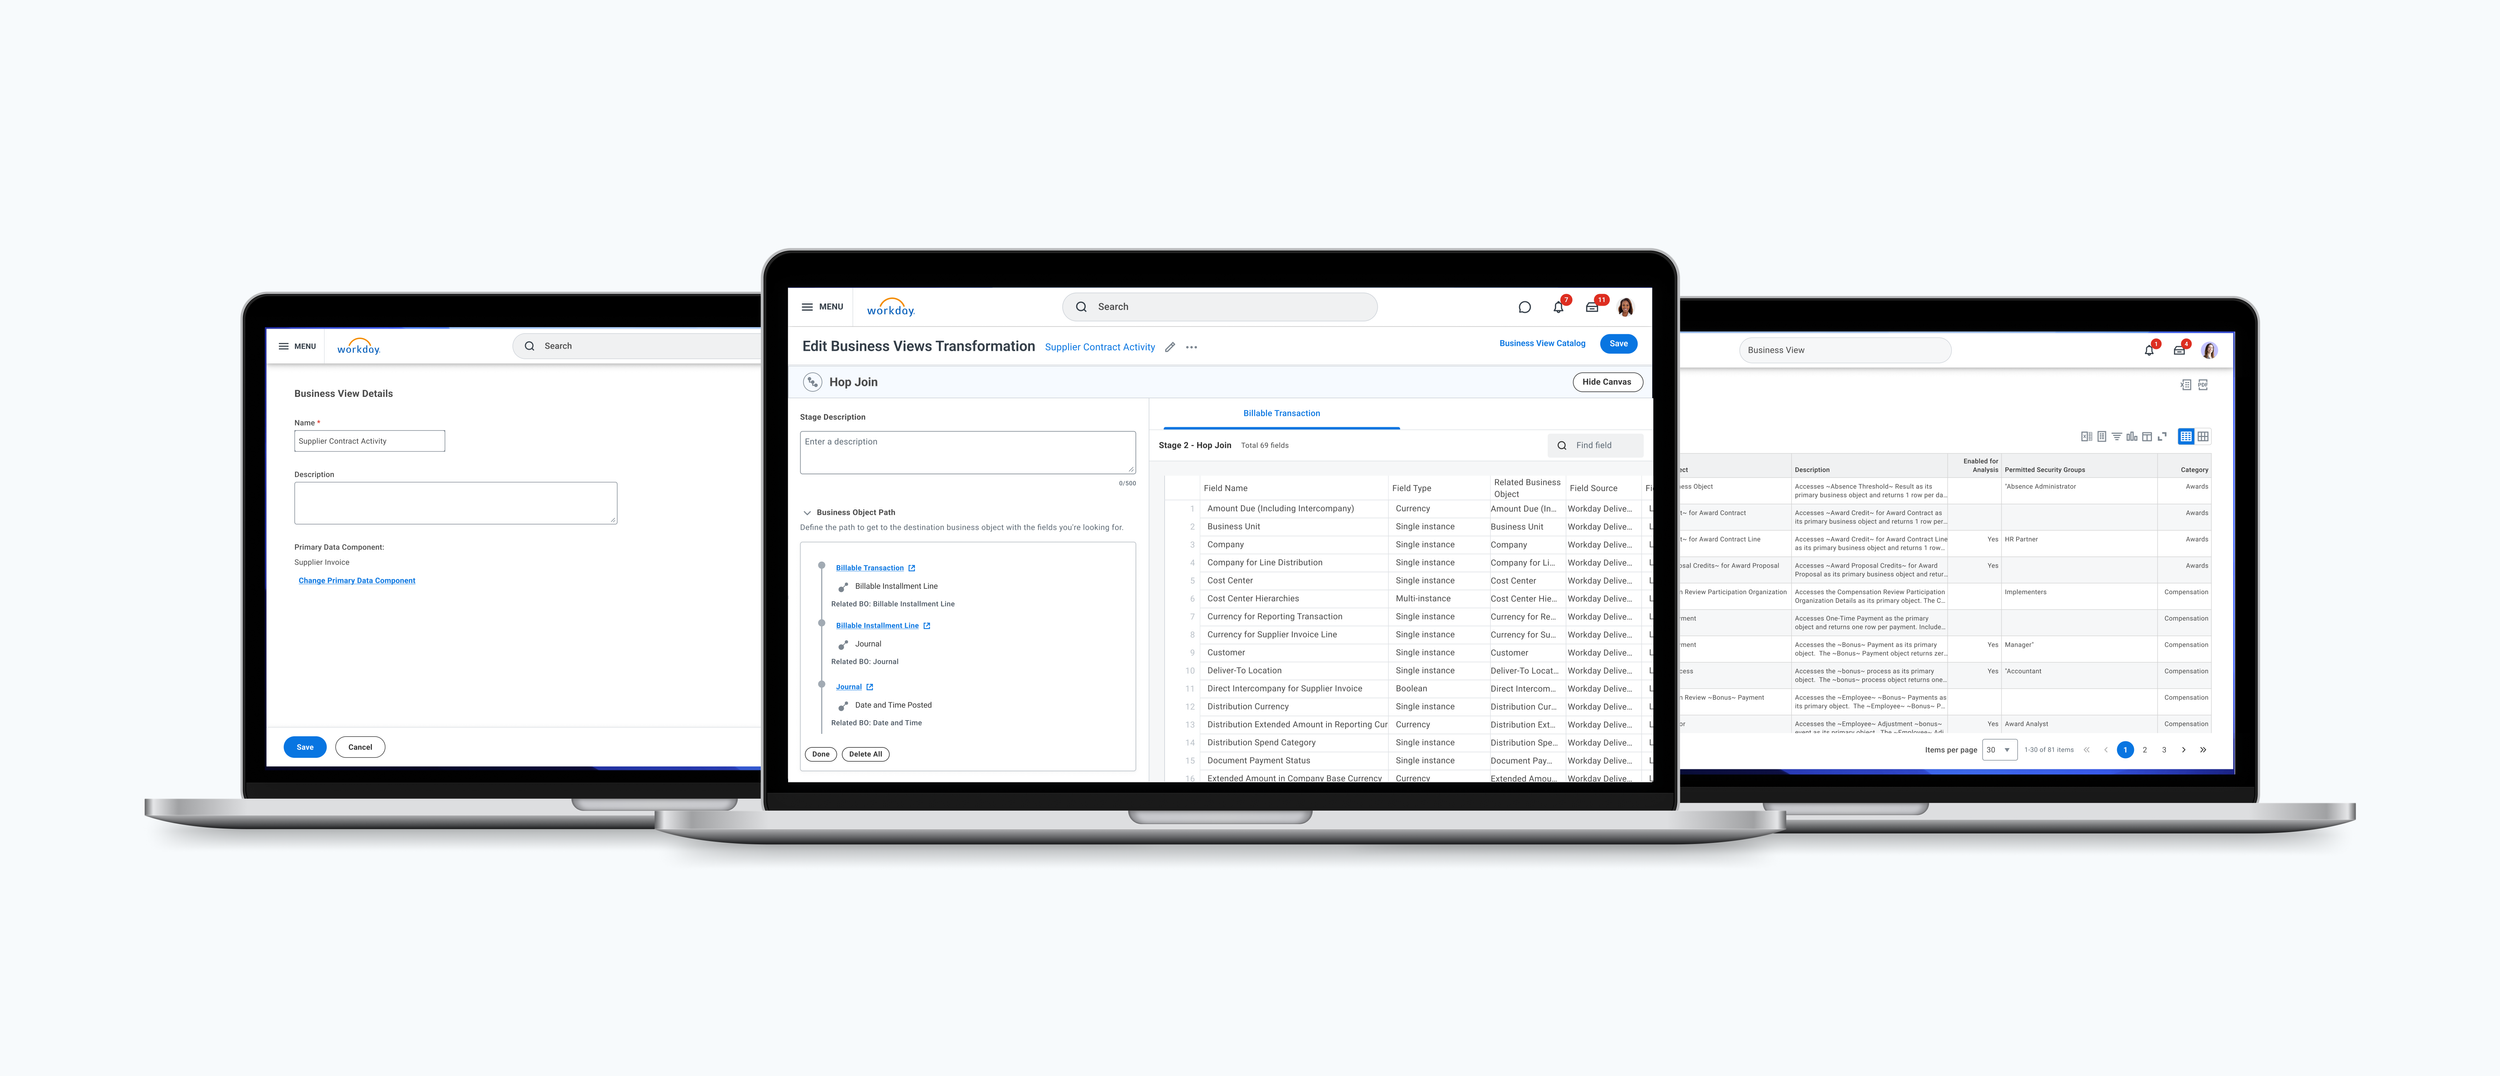
To implement the Business Views MVP, we intentionally kept the scope light—focusing on reusing patterns from the existing Workday Prism (data preparation) platform, with necessary modifications to support Business Views functionalities. We set aside more ambitious ideas, gathered from workshops and storyboards, for future phases. Recognizing this as a multi-release journey, we prioritized building a scalable foundation.
Below is the end-to-end flow, with one transformation stage highlighted.
← Previous Project
