Bahar's Portfolio WORK ABOUT ASK AI


Advanced Filter

An add-on feature for Discovery Boards, one of Workday’s analytics tools.


Role & Responsibilities
  • → Design Lead
  • → User Research
  • → Design System Contribution
Team
  • → A Core Team of A PM
  • → Technical Writer
  • → Principal Engineers
Platform
  • → Web Application
Year
  • → 2023

Background

Workday Discovery Boards is a self-service and ad-hoc analytics tool that enables business users to do ad-hoc analysis, and visualize their data in real time without heavy report-writing.

Advanced Filter feature was born out of the need for robust filtering in Discovery Boards that often led users to export data from Workday or exchange tooling for further analysis.


Design Objective

→ How might we enable Financial Analysts to create AND/OR filters and combine them to further restrict the data when running reports.


Discovery


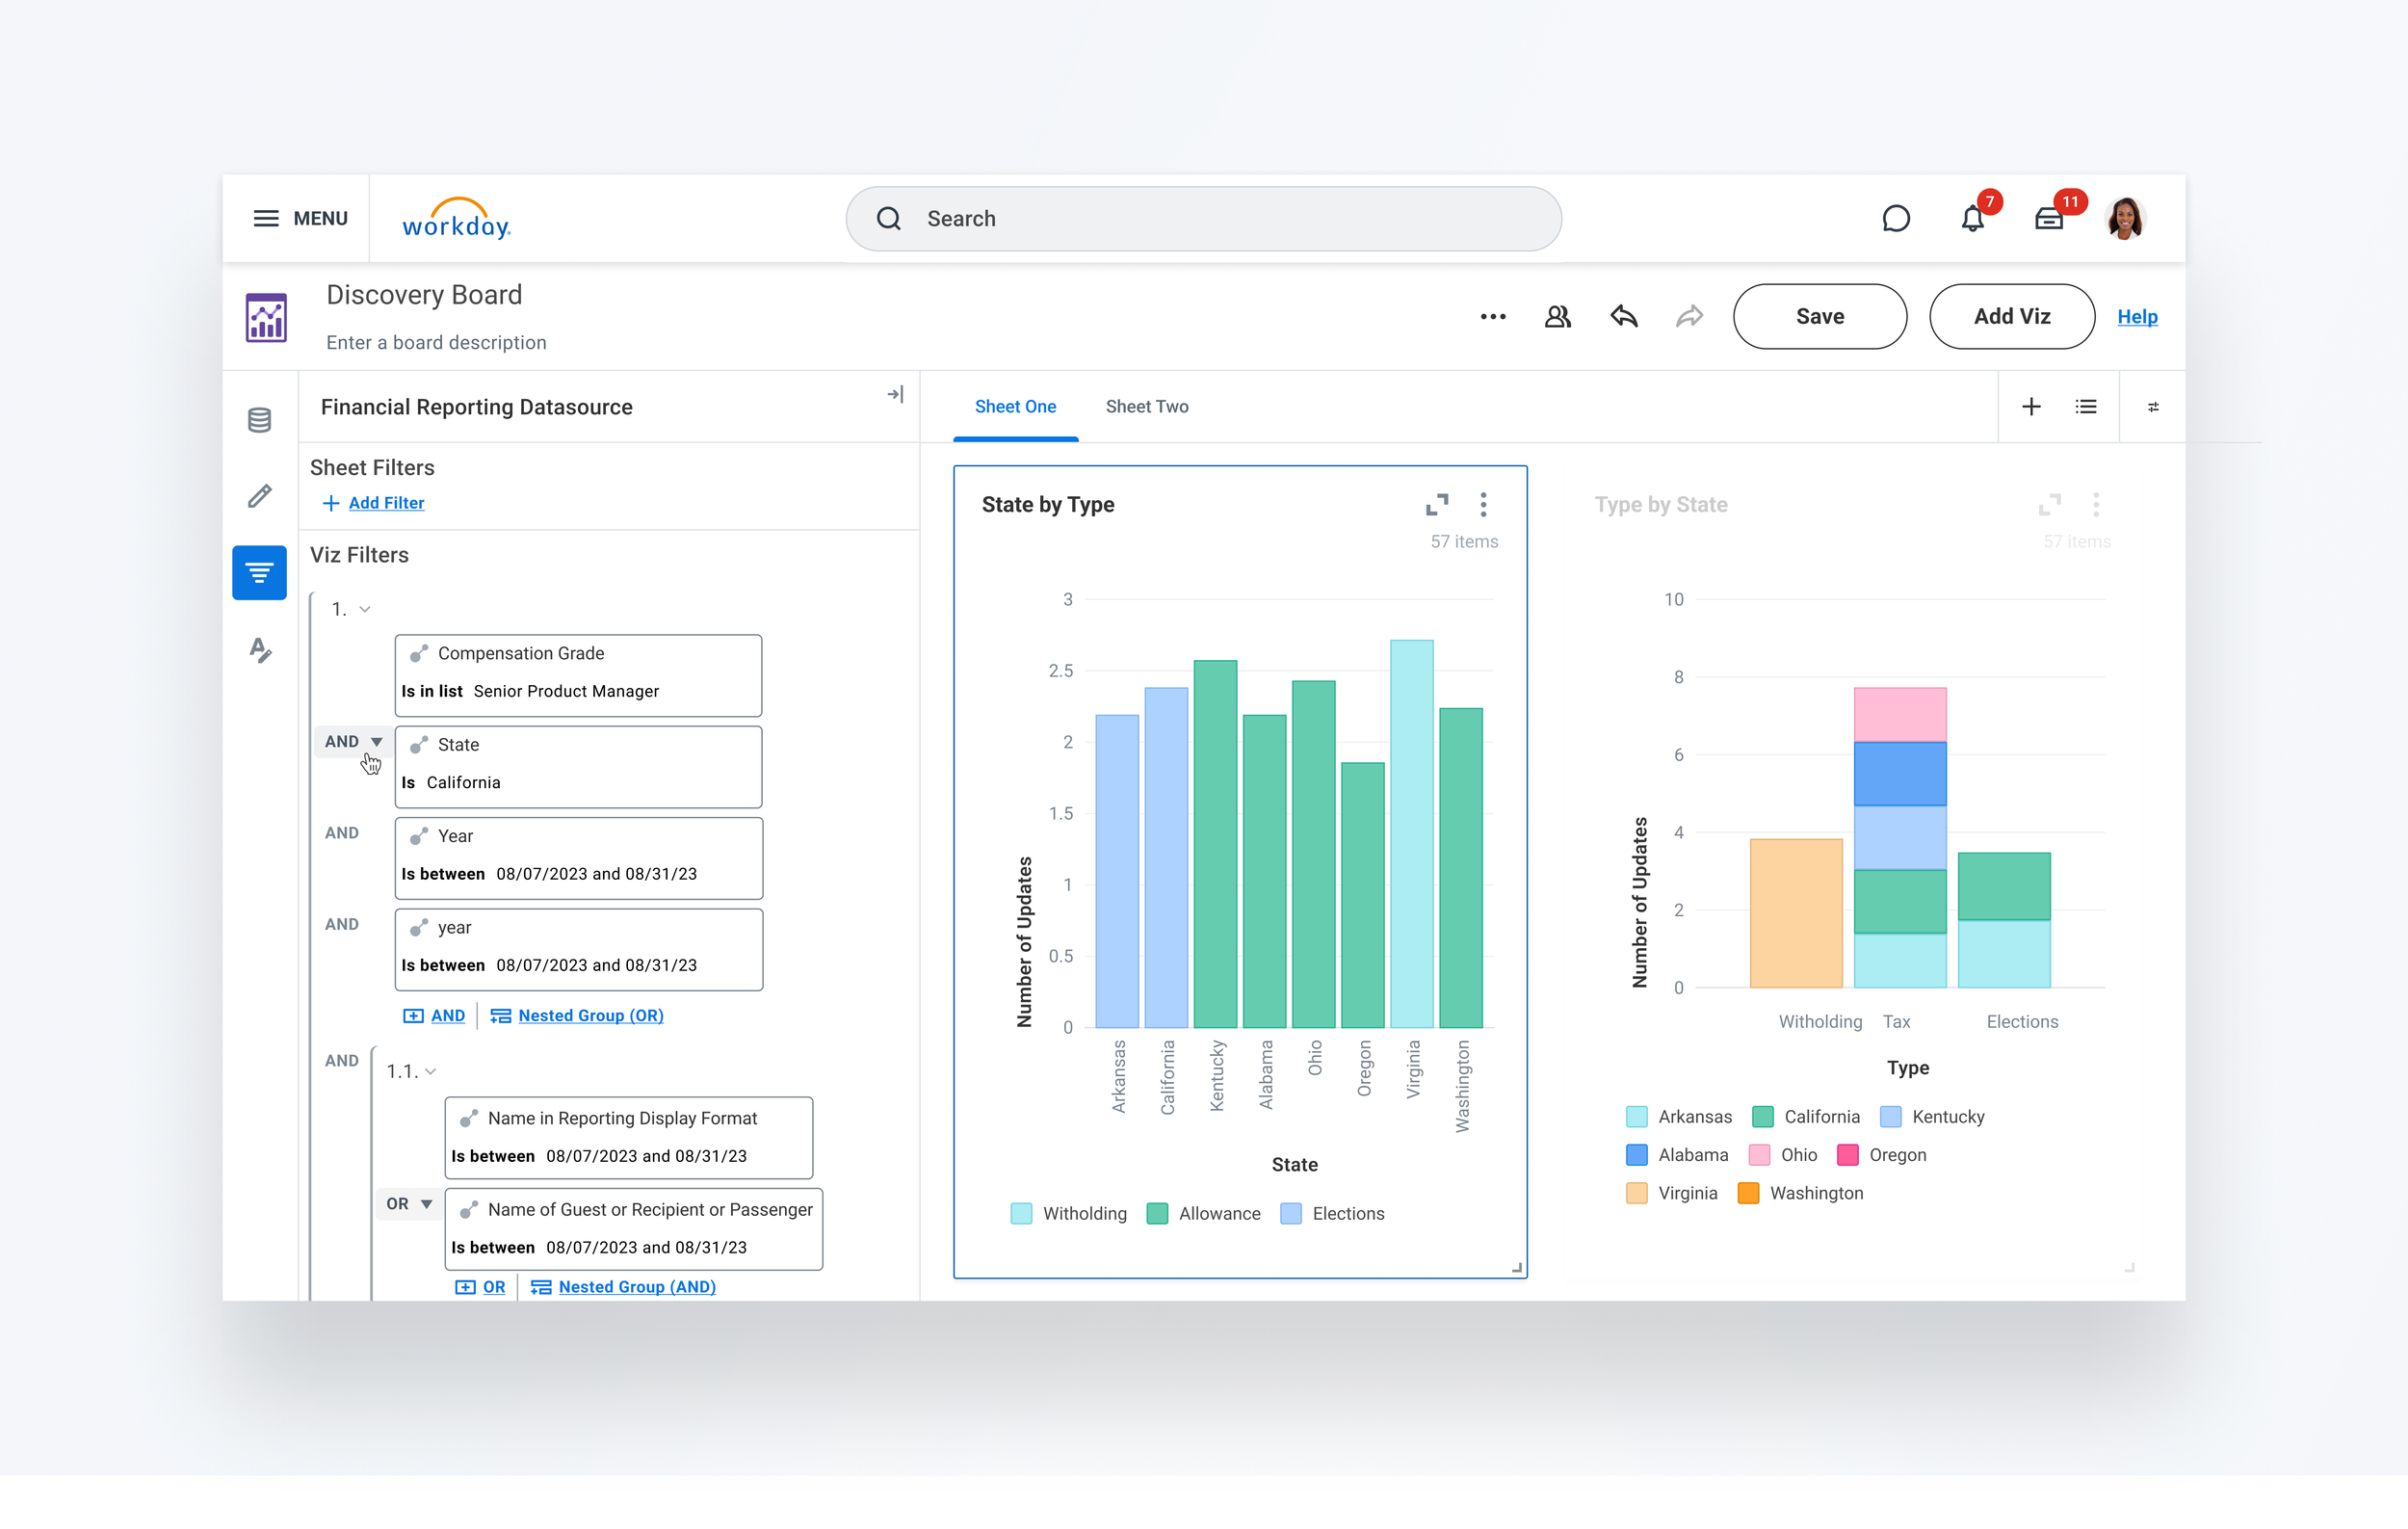
To expand on this, this was the original state of Discovery Boards, where filters only supported "AND" conditions (click). For example, users could filter by hire date in 2019 and California location, but not by hire date in 2019 or California. This was especially challenging for financial users with complex needs or use cases, often forcing them to export data or avoid the tool altogether. It also slowed performance when running the report due to large, unfiltered data sets.


Business Value

  • Unlocks Complex Financial Use Cases

  • Reduced Data Exports and Workarounds

  • Improved Performance and Query Efficiency


Design Process

  • Existing Alternative Analysis
    To kick off the initiative, I stepped back to look at the bigger picture and mapped out a UX roadmap centered on two key questions: How will users manage Business View data differently, and how will this impact analysis and reporting?

  • Competitive Analysis
    To dig deeper, I co-led a 2-day design thinking workshop with the Business View and Discovery Boards (one of workday reporting tools) teams . This helped us align on user needs, validate assumptions, and surface new opportunities.

  • Early Design Sketches
    Coming out of the workshop, I mapped ahigh level user flow and collaborated with both Business view and Discovery Boards team to craft a visionary storyboard to communicate a future experience that connected Business Views configuration, data management, and analysis. 

  • Design Iterations and Testings
    Finally, I worked with PM and devs to run an impact/effort analysis to prioritize features, identify quick wins, and shape the MVP scope for the design. 


Define

To implement the Business Views MVP, we intentionally kept the scope light—focusing on reusing some of patterns from the existing Workday Prism (data preparation) platform, with introducing new functionalities to support Business Views. We identified the phases of creating a Business View and the required steps within each phase which we had previously used for the storyboard. The process includes 4 core stages: Business View Catalog, Create, Edit transformation, and Enable for analysis.


User Photo

Data Admin

Nina

I help business teams (Finance, HR, Operations) to self-serve data insights via trusted and curated data set

1. Business View Catalog
  • Access to Business View Catalog
2. Create
  • Specify name & description
  • Import Primary Data Component
3. Edit Transformation
  • Define stages:
    • Join
    • Hop Join
    • Unions
    • Filter
  • Field curation:
    • Hide/show
    • Override Field names & descriptions
  • Save
4. Enable for Analysis
  • View Business View
  • Configure/set up Security
  • Enable for Analysis


Design


1. Business View Catalog

We started with the Business View Catalog—a central hub where users can view, edit, and create Business Views data sources, whether ready for reporting or still in progress.


2. Create


Users are taken to the Component Library—think of it like a bookshelf, a library of data “books.” Here, they can select or import a primary data component to blend and transform data, forming the foundation of a Business View. They can also name and add a description to provide context for the view.


MacBook Pro
Demo Content


Edit Transformation:
Hop Join Concept

Hop Join is a Workday-specific concept, unlike standard SQL joins or unions. It’s like navigating linked books (Business Objects)—starting with the Employee book, hopping to Department, then to Location to find Sara’s office. Currently, these connections or defining the path are made at the reporting stage, which is extremely complex or even not possible. Defining the path earlier at the data modeling layer makes reporting much easier to find a right data for reporting.

Export to Any Builder


MacBook Pro
Demo Content

3. Edit Transformation: Hop Join (New Stage)

Users then enter the Edit Transformation view, which follows the existing Workday Prism Data Platform. We introduced a new stage, Hop Join, to support Business View data relationships.

I went through multiple rounds of design iteration to balance usability, technical constraints, and timeline. In this design, users manually define the data path by hopping across Business Objects to reach the desired field.


Enable for Analysis


The first step in “Enabling the Data for Analysis” is configuring data security. That’s why users are prompted to set up Security before a Business View can be enabled for analysis. While most users understand this need, making it a required step ensures it’s not overlooked. Once a Business View is enabled and used in reporting, it can no longer be disabled for analysis.

MacBook Pro
Demo Content


Business Outcome

50+ New Financial customers joined the EA program to co-pilot the development of Business Views.


Design Outcome

  • Adopted across Analytics core products

  • Extended to non-Analytics use cases

  • Validated as a scalable UX pattern


plain-color.png